
The objective of this Tableau Certification course is to provide you the essential skills to master Tableau Desktop, a powerful tool extensively used for data visualization, reporting, and business intelligence. By enrolling in this course, you will acquire job-ready skills that are highly demand after by organizations for data-related roles, and it will enable you to advance your career in analytics. This hands-on experience will provide you with valuable exposure to the application of Tableau in different sectors. The Tableau training presented in this course is designed to help you excel in Business Intelligence tools, Data Visualization, and reporting. The program aims to equip you with the required knowledge and skills to clear Tableau Desktop, Analyst, and Server certification exams. Obtaining these certifications will give you an edge in the job market and help you progress in your career.
Application Deadline: May 31st, 2023
Upskill for Your Dream Job
Sambodhi and Education Nest offer a Tableau Certification course aimed at providing essential skills to master Tableau Desktop, a powerful tool used for data visualization, reporting, and business intelligence. The course equips participants with job-ready skills that are highly in demand by organizations for data-related roles, allowing for career advancement in analytics. The hands-on experience gained provides valuable exposure to the application of Tableau in different sectors. The Tableau training aims to help learners excel in Business Intelligence tools, Data Visualization, and reporting, with a goal of preparing them to clear Tableau Desktop, Analyst, and Server certification exams. These certifications give learners an edge in the job market and help them progress in their careers.


Instructor-led Data Visualization With Tableau live online Training Schedule
May 15th – Weekend
July 1st – Weekend
Why enroll for Data Visualization With Tableau Certificate Training Course?

According to the 2021 Gartner Magic Quadrant for Analytics and Business Intelligence Platforms, Tableau is a Leader for the 9th consecutive year, reinforcing its position in the market.

Financial Services, Healthcare, Retail, Government, Technology, Education, Bank of America, Facebook and many other MNCs worldwide across industries use Tableau.

As per Indeed, Tableau professionals in the US earn an average salary of $98,000 p.a., with entry-level roles earning around $60,000 p.a. and senior-level positions like Data Scientist earning over $150,000 p.a.

Data Visualization With Tableau Training Course Benefits
Data Visualization with Tableau training provides a wealth of benefits, including the acquisition of in-demand skills for data-related roles, the ability to excel in business intelligence tools, and a deeper understanding of data visualization and reporting. As a result, participants can expect to enhance their career growth opportunities and become highly sought after by organizations in need of data experts. With Tableau being recognized as a leader in the market for the 9th consecutive year, completing this training can provide a competitive edge in the job market and help individuals progress in their careers.
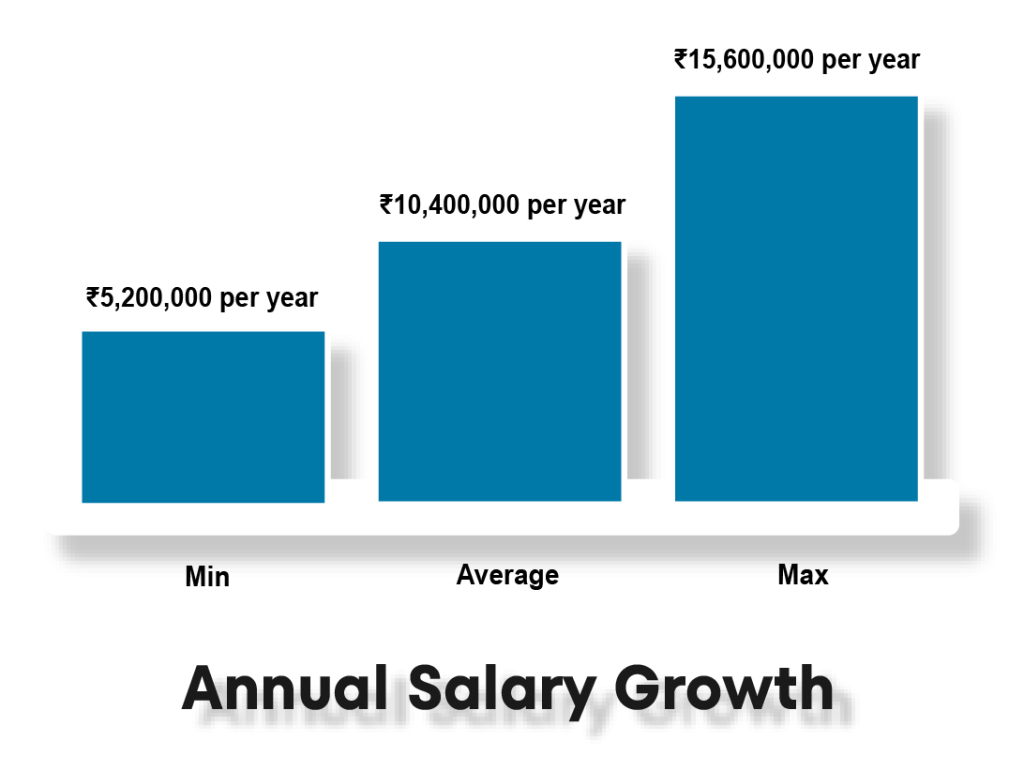
Annual Salary
Hiring Companies
Want to become a Data Visualization With Tableau
Professional?
Why Data Visualization With Tableau Certificate Training Course from Education Nest


Data Visualization With Tableau Skills Covered
Data Visualization With Tableau Training Course Syllabus
Data Visualization With Tableau Training Projects

Tableau has proven to be an excellent tool for data visualization in the retail industry, where large amounts of data need to be analyzed quickly and accurately. With Tableau, retailers can identify trends, patterns, and insights that are essential for making informed decisions about inventory, pricing, and marketing strategies. Retailers can also use Tableau to create interactive dashboards that provide real-time data, enabling them to track sales, monitor customer behavior, and improve operational efficiency. By learning Tableau, retail professionals can gain a competitive advantage and advance their careers in this dynamic industry.

Data Visualization with Tableau is a crucial skill in the IT industry, and professionals with Tableau skills are highly sought after. Organizations across various industries use Tableau for data visualization, reporting, and business intelligence. With the ability to create dynamic and interactive dashboards, Tableau has become a go-to tool for data visualization professionals. By completing a Tableau training program, individuals can gain hands-on experience and insights into the application of Tableau in different sectors. This practical experience can be utilized in various Tableau projects, such as data analysis, business intelligence, and predictive analysis, leading to a successful career in the IT industry.
Data Visualization With Tableau Training Description
The Data Visualization with Tableau course is designed to provide learners with a comprehensive understanding of Tableau Desktop, a leading data visualization tool used for reporting and business intelligence. The course covers the fundamentals of data visualization, best practices, and advanced techniques for creating interactive dashboards and visualizations. Participants will gain hands-on experience with Tableau and learn how to use it to analyze and present data effectively. Upon completing the course, learners will be equipped with job-ready skills that are highly in demand in the data-related roles across various industries. The course also prepares learners for Tableau Desktop, Analyst, and Server certification exams, which can give them an edge in the competitive job market.
Here are the objectives of the Data Visualization with Tableau course:
Here are some points on why one should learn Data Visualization with Tableau course:
Data Visualization with Tableau Course is suitable for individuals who want to learn data visualization techniques and enhance their skills in creating interactive dashboards and reports. The course is ideal for:
The pre-requisites for the Data Visualization with Tableau course are as follows:
It is important to check with the specific training provider for their pre-requisites before enrolling in the course.
There are many popular software options for data visualization beyond Tableau. Here are a few:
Microsoft Power BI: A data visualization and business intelligence tool that allows users to connect to a wide range of data sources, create interactive dashboards and reports, and share insights with others.
Python Visualization Libraries (e.g., Matplotlib, Seaborn, Plotly): Python offers several libraries for data visualization, each with its unique features and strengths, allowing users to create custom, interactive data visualizations using code.
Google Data Studio: A free cloud-based data visualization tool that allows users to connect to data sources, build and share interactive dashboards and reports.
These tools are used in various industries and can offer different features and functionalities based on your data visualization needs.
Data Visualization With Tableau Certificate Training Course reviews
Read learner testimonials
Shalini Sharma
I really had an overwhelming experience with Education Nest. The Tableau course by Sambodhi provided comprehensive knowledge and hands-on experience. Highly recommend it.
Liam Davis
Trainer was excellent, course content was thorough and well-organized. Highly recommend Sambodhi and Education Nest for Data Visualization training.
Aarav
Excellent course with great instructor, Raghavendra. Well-structured content and helpful Q&A sessions. Highly recommend Sambodhi and Education Nest for Data Visualization training.
Hear from our learners
Lorem ipsum dolor sit amet, consectetur adipiscing elit. Ut elit tellus, luctus nec ullamcorper mattis, pulvinar dapibus leo.
Lorem ipsum dolor sit amet, consectetur adipiscing elit. Ut elit tellus, luctus nec ullamcorper mattis, pulvinar dapibus leo.
Lorem ipsum dolor sit amet, consectetur adipiscing elit. Ut elit tellus, luctus nec ullamcorper mattis, pulvinar dapibus leo.
Like what you hear from our learners?
Creating Epic Presentations: Communicating Powerful Ideas reviews
Data Visualization With Tableau Training FAQs
If you miss an online Data Visualization With Tableau class, it’s important to reach out to the instructor or the support team of the online training platform you are using. They may be able to provide you with a recording or transcript of the missed class, so that you can catch up on what you missed. Alternatively, some platforms offer on-demand access to class materials, so you can go back and review the content on your own time. It’s always a good idea to try and make up the missed material as soon as possible, so that you don’t fall behind in your learning.
If you have queries after completing an online Data Visualization With Tableau course, Education Nest training platforms offer some form of post-course support. This may include access to a dedicated support team, a community forum where you can ask questions and connect with other learners, or even one-on-one sessions with an instructor or coach. If you have specific questions or concerns related to the course material, you can reach out to the instructor directly or use the support channels provided by the platform. It’s always a good idea to clarify any doubts or questions you may have, as this will help to solidify your understanding of the material and ensure that you can apply what you’ve learned in a real-world context.
Data Visualization with Tableau is a training program that teaches individuals how to create effective visualizations and dashboards using Tableau software. Tableau is a powerful and widely used business intelligence tool that allows users to easily connect to data, create interactive visualizations, and share insights with others. This course covers the fundamentals of data visualization, including how to analyze and present data effectively, as well as the specific features and functions of Tableau that allow users to build compelling visualizations. Students learn how to create interactive dashboards, use filters and parameters to explore data, and design effective visualizations for different types of data and audiences.
The timing of when you get access to learning content after signing up for an online Data Visualization With Tableau course will depend on the specific training platform you are using. In most cases, you should receive access to the learning content immediately upon signing up, or shortly after your payment has been processed. Some platforms may require you to complete an enrolment process or set up an account before you can access the content. It’s always a good idea to check the specific details of the course or platform you are using, as the timing and process may vary. If you are experiencing any issues accessing the learning content, you should contact the support team of the training platform for assistance.
Once you enrol in a Data Visualization With Tableau Training course, you will typically have access to the course material for as long as the course remains available on the platform. This means that you can revisit the material at any time, even after you have completed the course, and continue to learn and improve your skills.
The benefit of lifetime access to the learning material is that it allows you to learn at your own pace and on your own schedule. You can review the content as many times as you need to fully understand the concepts and techniques covered in the course. Additionally, if you encounter a new challenge in your work or personal life, you can go back to the course material to find solutions and strategies to help you overcome the challenge.
Be future ready, start learning